
My Two Cents - "A Look Behind the Numbers"
03/06/2009
The much-anticipated employment situation report for February 2009 has now been released. Markets breathed a sigh of relief, following recent conventional wisdom that things could have been much worse. Clearly they could have been. Clearly they are. December and Januarys numbers were both revised much higher (577,000 to 681,000 and 589,000 to 655,000 respectively). There is little doubt that when next months report rolls around that the current stated loss of 651,000 will be revised much higher as well; likely to the 700,000 area.

What is even more alarming is that these numbers dont include what could be called partially discouraged workers. These are the folks who are working part-time, but not by choice. Theyd like to work full-time, but have either had their hours cut or are unable to find full-time employment. There are now over 9 million of these folks in the United States according to Bureau of Labor Statistics (BLS). Well take a closer look at this segment of the labor force later in the article. While it is understood that the methodologies of BLS are largely political and are compromised in terms of relevance, the trends are still helpful in terms of extracting clues about where things are headed, and getting an idea of exactly how many folks are under job-related duress.

Looking at the aggregate numbers - in what has become a recurring theme - government, education, and healthcare were the only three areas in which there was growth in February. These three areas added 35,000 jobs during that time. Here is a brief summary of some of the more notable industries:
Goods-producing industries lost another 276,000 jobs in February for a grand total of 1.456 million just since September 2008.
Manufacturing lost 168,000 jobs in February for a total of 891,000 since September 2008. Most of these losses were concentrated in the durable goods, tool, and machinery sub-sectors.
Construction lost 104,000 jobs and the once-venerable sector has shed a total of 551,000 jobs since September 2008. The industry has lost 1.1 million jobs since peaking out in January 2007.
The service sector has been hit particularly hard, losing 375,000 jobs in February and a grand total of 1.77 million just since September of last year. A healthy portion of these losses have occurred in the financial arena including investments, credit intermediation, real estate, mortgages, and banking.
One area that has held up reasonably well so far is leisure and hospitality. This industry is ripe for a pullback, however, as Americans continue to cut back on discretionary purchases. Stories of free hotel rooms in Las Vegas and other trendy tourist spots are becoming more and more commonplace as firms in the sector engage in a frantic race to capture waning consumer dollars and cover their fixed costs.
Compromised workers a more accurate measurement?
Perhaps a more useful measure is the degree to which incomes and earnings have been compromised. To get a reasonable representation of this, we can take the total amount of individuals on unemployment and add to that the number of individuals who are working part-time for economic reasons. This does not include people who choose to work part-time, but have to. When you add these two groups together, you come up with almost 23 million Americans or nearly 15% of the workforce. Compare this with the BLS advertised 8.1% rate and you see a very different picture.

To get a better idea of the scope of the unemployment problem, add in the people who are given the choice of taking a pay cut or losing their job plus those who have fallen off the unemployment rolls. Lets mention one more group in here too. What about the people who retired over the past few years only to find their retirement accounts wiped out and who are now in need of work? While there is no way to easily track these folks, the anecdotal evidence suggests that this group is much larger than most policymakers and pundits would care to admit.

Like it or not, to one degree or another, all the aforementioned folks are unemployed, even if only partially, in that theyve lost a portion of their income. Compromised incomes translate directly to lost consumer spending, which translates directly to lost GDP. The bottom line is that these folks dont spend much money. Nor can they easily be induced to borrow especially to purchase discretionary items.
MTC Economic Distress Index
Confusing isnt it? So many numbers lead to even more interpretations, so weve tried to make this a bit simpler for folks. To do this, we created a weighted index which takes into account compromised workers (from the data in the chart above), consumer prices (domestic purchasing power), the trade-weighted Dollar (purchasing power abroad), and the burden of consumer credit. We update the numbers each month and the chart (seen below) each quarter. Due to the lag involved in gathering credit numbers, the current index is for January 2009. To give a better graphical representation of the impact over time, we ran the data series back to January 2000. Further explanation of the chart and data as well as updates may be found at: http://www.my2centsonline.com/edi.php
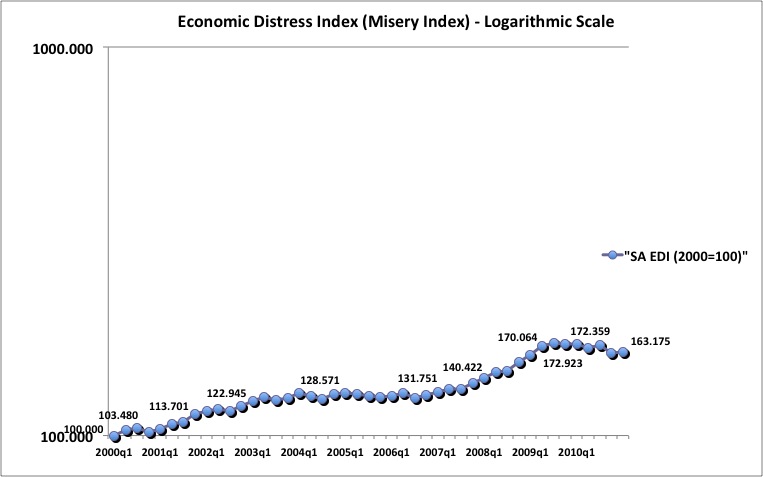
12/08 = 160.93; 01/09 = 163.37 (1.52% - 18.19% Annualized)
All of the data listed herein only serve to illustrate and underscore the need for America to focus on productive employment. Emphasis on productive. Government attempts to spur employment by increasing the hiring rate of paper-pushers, government bureaucrats, and regulators produces nothing and in fact constitutes a further drag on economic growth. Private sector investment at this time is key to reviving America. What we need in this country is another industrial revolution. Free trade agreements need to be recognized as being unfriendly to American prosperity and summarily fed to the shredder. The sooner the better. Otherwise, there will be little in the way of prospects for future employment reports and our economy will be further devastated.
Dont miss out on your free copy of our report The 7 Mistakes Investors make..and how to avoid them. Get your copy today by going to our website www.suttonfinance.net and clicking the free report banner.
Until Next Time,
Graham Mehl is a pseudonym. He is not an âinsiderâ. He is required to use a pseudonym by the policies of his firm when releasing written work for public consumption. Although not an insider, he is astonishingly bright, having received an MBA with highest honors from the Wharton Business School at the University of Pennsylvania. He has also worked as an analyst for hedge funds and one G7 level central bank.
Andy Sutton is a research and freelance Economist. He received international honors for his work in economics at the graduate level and currently teaches high school business. Among his current research work is identifying the line in the sand where economies crumble due to extraneous debt through the use of economic modelling. His focus is also educating young people about the science of Economics using an evidence-based approach.