My Two Cents - "Basic Financial Analysis - Part III"
07/10/2009
Before we begin, it must be understood that there are many perceptions of value. In fact, if you took 10 investment professionals polled them individually; youd likely get several very different definitions of value. If you put them together and forced them to come to a consensus, you would do well not holding your breath waiting for an answer. While there is no one right definition especially in the investing world, what we are looking to do is select a metric or some group of metrics that applies to our particular situation. Again, investing should not be approached with a one size fits all mentality. It must also be said that this list is not a comprehensive one, but rather a sampling of some of the methodologies available for ascertaining value.
The Mainstreams Darling - P/E
If you turn on your television, perhaps the most popular measurement of value is the price/earnings or P/E ratio. While P/Es are mentioned frequently, rarely does anyone stop to really think about what it represents. Simply put, the P/E ratio is the price of a share of stock divided by the earnings per share. In essence, it is how many dollars you will pay in share price for each dollar of earnings. I will be honest; I rarely use P/E as a decision tool simply because I dont believe it is applicable in most situations. An average investor is not buying earnings. Sure, earnings may help drive the share price in the future, but they just as easily might not. News events about a company can drive price as much if not more than earnings, so perhaps a Price/News ratio would be appropriate too? And really, why would anyone ever want to pay more than a dollar for a dollars worth of earnings anyway? By definition then, a P/E of greater than 1.0 would mean the stock is expensive. The argument will also be used that one is not simply buying the earnings, but a claim on the assets of the corporation. While this is theoretically true, you cant drive down to your local Home Depot and take a truckload of lumber out of the store without paying just because youre a shareholder! So there are many conceptual problems with the idea of P/E ratios yet once the P/E of the DOW goes below a certain point, were supposed to buy because stocks are now cheap. This to me is drawing some parallels that are eerily similar to herd mentality. All this should not be construed as an indictment of the P/E ratio, but rather to point out its limited relevance in terms of determining value.
Another frequently used, but less popular metric is the Price/Book ratio or P/B. Simply put this is dollars paid in share price for each dollar of book value. This is more of a liquidation metric, however, than an actual investing metric. Now there are some obvious instances where once might sniff out a bargain. Our example in the prior weeks issue of food companies is a bit lacking, but lets use the example of a natural resource company. If for example, the company has proven resources in its properties and the P/B is .75, we might, in the absence of extenuating circumstances conclude that this is a bargain and that the stock is currently undervalued.
Some Situational Metrics Cash Flow Generating Securities
One of my personal favorites is calculating the Net Present Value/Breakeven point for a stock that pays a stable dividend stream. This metric actually has relevance because the dividend is a cash payment that comes directly to the investor as a consequence of owning the shares. In the short-term, dividends are a known quantity. Obviously the metric only applies in the case where a dividend is paid. In the case where an investor is focusing on dividend investing for income purposes or simply for generating the maximum cash from their investing capital, these are important considerations. An example is on order. Lets say that an investor purchases 100 shares of a stock trading at $10/share that pays a $1/share annual dividend. The dividend yield on his investment is 10%. The P/Div ratio is 10. This means that the investor paid $10 for every dollar in dividends. Now the nice thing about dividends is that they are cash streams and we can use some common time value of money calculations to make determinations as to whether or not to invest. Lets use the 100 shares as an example and do a net present value calculation with the following assumptions:
Our time horizon is 25 years
Dividends over the 25 years will average the current $1/year
The Cost of Capital (COC or inflation) will be 6%/year for the duration of the exercise
Most popular spreadsheet programs contain the NPV function where you can set your COC and the value of the individual cash flows if you desire to perform this analysis for yourself. The Net Present Value of this situation is $262.58, giving a positive indication or a buy signal. This alone should not be used to make a buy determination, but should be used as a tool to validate or invalidate individual investment opportunities that arose from our analyses in parts I and II.
The Time to Cover or Breakeven point of this hypothetical investment is Year 15. What this means is that after 15 years, the dividends (after accounting for the deterioration in value due to inflation) will cover the cost of the initial investment. Whatever the investment itself is worth at that time is added value. So even if our stock is still at $10/share, it is paid for, were in the clear, making dividends for another 10 years before we need the funds, and can sell the stock at any time thereafter for a pure profit. And since inflation has already been figured in, were talking about real gains. We can easily modify the analysis to accommodate hypothetical taxation circumstances as well.
Another important point may also be made from the above analysis. Considering that were getting $1/year in dividends, in nominal terms, the Time to Cover/Breakeven would be 10 years. Inflation at a rate of 6% per annum increased the breakeven point by 50% or 5 years. While 6% doesnt seem like that much, this example illustrates exactly how much of a burden on wealth it represents. If anyone really wants to see why clipping bond coupons isnt such a hot idea, run this analysis on the 30-year Treasury Bond and it will become immediately obvious.
Moving forward, when looking at dividend paying investments, we are looking for lower P/Div ratios (higher yields), and consequently lower Time to Cover/Breakeven points. While looking at the yield gives some good insight, using the NPV and breakeven analysis allows us to quantify the deleterious effects of inflation over time. The yield alone doesnt give us that ability since it is a snapshot in time and changes as the price of the underlying security changes. It is important to note that in this study, we are NOT valuing the firm. We are valuing the cash streams that the firm pays to shareholders and discounting them to the present. The risks to the above analysis are obviously many. 25 years is a long period of time, and things can change dramatically. Firms can go out of business or eliminate dividend payments thereby rendering the above effort worthless. Also, the major types of risk such as market, currency, political, and systemic cannot be accounted for over such a long period of time. This is one of the reasons why it is never a good idea to buy today and walk away. Successful investing is a journey, not a destination. As soon as you think youve got it all figured out, that is when youll get bitten. Vigilance is the name of the game. Another obvious takeaway here is that were dealing with long term investing, not trading. Such studies are a moot point for the short-term trader since their focus is on a different goal. Realize I am not trying to be impertinent towards traders, but simply pointing out the difference between their objectives and those of long-term investing.
Non Cash Flow Generating Securities
For firms that do not pay dividends, the investor is limited to just one way to make money directly (other than writing options) from owning the stock and that is appreciation. In this situation, choosing appropriate themes becomes even more important because say for example, you selected a firm that pays no dividend and is in a market niche that relies heavily on discretionary consumer spending. When the economy entered into recession in late 2007, you would have had very little in the way of flexibility since there is in effect no longer anything supporting the price of your stock. Youre not being paid dividends while you wait out the business cycle. So you can either write covered calls and ride out the storm or just pull up stakes and get out of town. Below are charts of the XLY (Consumer Discretionary Sector) and the XLP (Consumer Staples Sector).
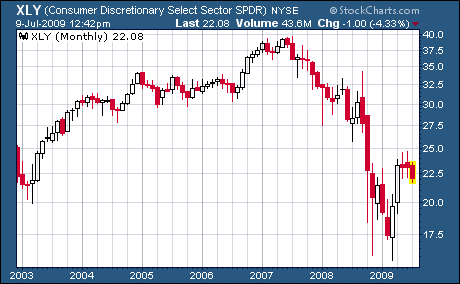
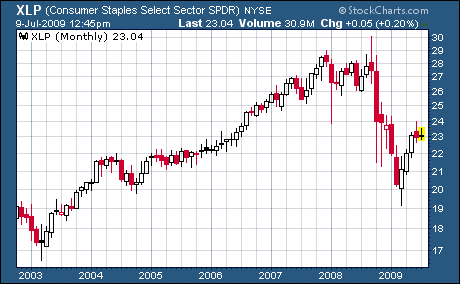
Lets compare these two distinctly different themes. From peak to trough, the loss for XLY was approximately 58% while the loss for XLP was 29%. For sure, 29% is not anything to write home about, but it does serve to illustrate the importance of picking the proper themes.
Earnings Growth
However, there is one quantitative metric that is very useful in determining the success of a firms operations in the absence of dividends, and that is earnings growth. I prefer using earnings growth to sales growth or margin growth simply because earnings are at the bottom of the income statement and represent the impact of the entire operation including all of its cost centers on the bottom line. Companies that are able to consistently grow their earnings even during troughs in the business cycle are obvious candidates for any investors portfolio. While it remains true that the investor isnt paid those earnings, companies that make money and grow their earnings are generally looked on favorably by the market, and as such are positioned to do well, all else being equal. One spinoff of this methodology is the PEG ratio or price/earnings/growth, which is stated below:
P/E Ratio
-------------------- = PEG Ratio
EPS Growth
The PEG ratio gives some degree of relevancy to the P/E ratio because it factors in growth. Obviously, the lower the PEG ratio, the cheaper the stock is because in essence, youre paying less for growth. Or, put another way, youre paying less for the likelihood that the stock will go up in the future all other things being equal.
When valuing firms that dont pay cash streams to the shareholder, it also becomes important to focus on intangibles because many times, they are what will drive the share price, rather than solid fundamentals such as earnings growth. There is an old market saying that goes as follows: The market can be wrong far longer than you can remain solvent betting against it. If you have the luxury of a long time horizon and no immediate need for your cash, you can afford to buy into the themes you feel will do well in the long term, monitor them, and wait for the market to sort it all out.
This is one of the main reasons I prefer dividend-paying investments. First of all, from an analysis standpoint, they provide something quantitative to analyze. Secondly, if youre a long-term investor and the market hasnt gotten on board with you yet, you are being paid (in some cases very handsomely) to wait. Thirdly, if you come to a decision where youd like to retire and need some income, you already have it coming in. Youre not forced to sell into a potentially bad market to find income.
Next time well take a look at risk, diversification, and portfolio construction now that weve been able to select our themes, come up with some portfolio candidates, and use various metrics to make some value judgments regarding those candidates.
For investors who are concerned about battling inflation, and operating within our new economic paradigm of spiraling debt and taxation, we are hosing a complimentary seminar on July 28th in Bethlehem, Pennsylvania. For anyone who would like more details, information, or registration instructions, please visit www.sutton-associates.net/seminar_reserve.php
Disclosures: None
Until Next Time,
Graham Mehl is a pseudonym. He is not an âinsiderâ. He is required to use a pseudonym by the policies of his firm when releasing written work for public consumption. Although not an insider, he is astonishingly bright, having received an MBA with highest honors from the Wharton Business School at the University of Pennsylvania. He has also worked as an analyst for hedge funds and one G7 level central bank.
Andy Sutton is a research and freelance Economist. He received international honors for his work in economics at the graduate level and currently teaches high school business. Among his current research work is identifying the line in the sand where economies crumble due to extraneous debt through the use of economic modelling. His focus is also educating young people about the science of Economics using an evidence-based approach.