
My Two Cents - "Hurricane Hunter"
09/25/2009
As global stock markets navigate through the eye of the ongoing financial hurricane, it becomes increasingly important for investors still impacted by these markets to be able to gauge when the storms fury will reassert itself and plan accordingly. By all measures, there are a healthy number of individual investors still in the stock markets in one way or another who are hoping to recover everything lost in 2008. The good news is theyve gotten a nice chunk back. If theyve been proactive as weve advocated, then theyre ahead of the game. However, it is important to note that we are operating within the context of a bear market rally; and this bear market still has a lot of teeth left. I am writing this article now, before the DJIA cracks 10,000, because once it does no one will be listening and the opportunity will have been lost.
The Hindenburg Omen
Once it has been established that we are in fact looking for a top, the next order of business is to try to get a handle on when that top might occur. This week well take a look at once such indicator; the Hindenburg Omen. Before we even start it must be said that this indicator is not a be all end all and should only be used in conjunction with other technical indicators, a broad understanding of the macroeconomic environment, and a healthy dose of common sense. It is merely a tool. It is not a magic wand. Such things do not exist.
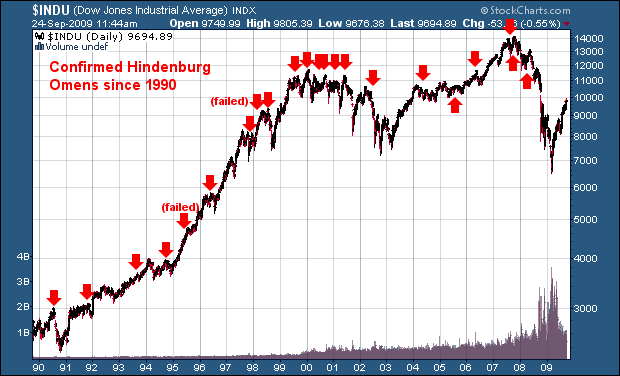
Essentially, the Hindenburg Omen is an indicator of underlying divergence in the movement of the issues traded on the New York Stock Exchange (NYSE). It is stock market sonar, meant to scan underneath apparently placid waters, searching out turbulence beneath the surface. Merely looking at the daily progression of the price of the major market indexes will not glean any light whatsoever on the actual internal condition of the markets. Examples of such divergence generally happen around major tops, which is what the Omen has been rather good at sniffing out. In the past 25 years there has not been a major market crash event without a confirmed Hindenburg Omen. However, to be fair, it must also be said that every Hindenburg Omen has not resulted in a market crash during this same period of time.
Hindenburg Omen Criteria
There are 5 criteria that must be observed on a particular day in order for a Hindenburg Omen to be registered. They are:
52-week Highs and Lows must both be greater than 2.2% of the issues traded on NYSE.
The lower of the Highs/Lows must be greater than 75.
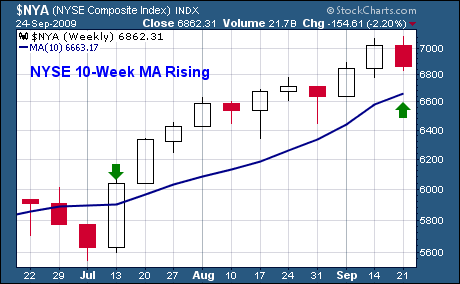
The 10-Week NYSE Moving Average must be increasing
The McClellan Oscillator must be negative.
The 52-week Highs cannot be more than twice the number of 52-week Lows, but the number of Lows can be more than twice that of the Highs.
An optional condition for the Hindenburg Omen, which has been found to be extremely beneficial in honing the accuracy of the indicator, is a confirmation within 36 trading days of the initial observation. So in order to have a confirmed HO, two observations need to be made within 36 trading days of each other.
Lets take a look at the Hindenburg Omens of the past 25 years. It is important to note that the indicator is not exclusively prescient. It will sometimes trigger prior to a crash event, sometimes it is coincident with the beginning of the crash event (the market top), and sometimes it comes slightly after the crash has begun.
Historical Occurrences
In the past 25 years, there have been 27 confirmed Hindenburg Omens and 191 individual occurrences of the Omen. Thus, the rate of occurrence was around 3%. Heres the breakdown of what happened after those 27 confirmed Hindenburg Omens:
DJIA decline of 15% or more: 8 times or 30%
DJIA decline of 10-14.9%: 3 times or 11%
DJIA decline of 5-9.9%: 10 times or 37%
DJIA decline less than 5%: 6 times or 22%
Of the last group, 2 of the declines were less than 2% and therefore considered failures in terms of the predictive value of the signal. Looking at it a different way, there is a near 78% chance that a confirmed Hindenburg Omen will result in a 5% or greater decline in the DJIA. In the context of the current position of the DJIA, we would have a 78% chance of at least a 480 point drop if we had a confirmed HO. Fortunately, as of this time we do not, and in fact do not have even an unconfirmed observation. Below is the chart of data for the Confirmed Hindenburg Omens shown.
Incidentally, there is no relationship at all between the number of observations and the magnitude of the resultant decline (Correlation between series: -0.01)
Date of First Signal |
Number of Observations |
Drop in DJIA - % |
6/6/2008 |
6 |
47.3% |
10/16/2007 |
9 |
16.3% |
6/13/2007 |
8 |
7.1% |
4/7/2006 |
9 |
7.0% |
9/21/2005 |
5 |
2.2% |
4/13/2004 |
5 |
5.4% |
6/20/2002 |
5 |
23.9% |
6/20/2001 |
2 |
25.5% |
3/12/2001 |
4 |
11.4% |
9/15/2000 |
9 |
12.4% |
7/26/2000 |
3 |
9.0% |
1/24/2000 |
6 |
16.4% |
6/15/1999 |
2 |
6.7% |
7/2/1998 |
1 |
19.7% |
2/22/1998 |
2 |
0.2% |
12/11/1997 |
11 |
5.8% |
6/12/1996 |
3 |
8.8% |
10/09/1995 |
6 |
1.7% |
9/19/1994 |
7 |
8.2% |
1/25/1994 |
14 |
9.6% |
11/03/1993 |
3 |
2.1% |
12/02/1991 |
9 |
3.5% |
6/27/1990 |
17 |
16.3% |
Where do We Stand Currently?
Based on 9/24/2009 closing numbers, this is where the various requirements for a Hindenburg Omen stand:
52-Week Highs: 157 (4.97%) - Met
52-Week Lows: 3 (.10%) - Not met
Lower Greater than 75? - Not met
52-Week Highs < 2X greater than 52-Week Lows Not met
10-Week MA: Rising - Met
McClellan Oscillator: -112.34 - Met
The above analysis indicates that while some requirements have already been met, that the level of bearish divergence necessary to generate the required number of 52-week lows still doesnt exist. Keep in mind that these numbers change daily and therefore, must be watched continuously.
Worth Noting
Two failures of a confirmed Hindenburg Omen to predict a more significant drop in the DJIA during the past 25 years were accompanied by significant liquidity injections by the Federal Reserve to stave off the decline. Chalk these up to either coincidence or overt market manipulation. These injections were $155 and $148 Billion and occurred in 2004 and 2005 respectively. Just three years later, multiple trillions were required and were still not enough to keep a 50% crash at bay. This alone should reinforce the notion of a hyperbolic growth in debt, leverage, and systemic risk.
Until Next Time,
Graham Mehl is a pseudonym. He is not an âinsiderâ. He is required to use a pseudonym by the policies of his firm when releasing written work for public consumption. Although not an insider, he is astonishingly bright, having received an MBA with highest honors from the Wharton Business School at the University of Pennsylvania. He has also worked as an analyst for hedge funds and one G7 level central bank.
Andy Sutton is a research and freelance Economist. He received international honors for his work in economics at the graduate level and currently teaches high school business. Among his current research work is identifying the line in the sand where economies crumble due to extraneous debt through the use of economic modelling. His focus is also educating young people about the science of Economics using an evidence-based approach.