My Two Cents - "Short-Term Rates Cause Long-Term Problems"
02/25/2010
One of the first orders of business that goes on during most initial meetings with a mainstream financial advisor is an inventory of assets, income, and other particulars. What generally follows next is series of pie charts that lumps you into one of three or four categories along with projections of your future wealth if youll only contribute $3,000/year to that IRA for two decades. Weve all heard the spiel. By contributing a mere pittance, you too can retire to millionaire acres in just 30 years. While there have been many candidates for financial crime of the century (even though were only 10 years in), this one has to rank right up there.
We have chronicled the damage that Bernankes pursuit of QE and near-zero rates have done to savers. Mainly, weve focused on short-term implications for those investors who rely on their savings to create income for immediate consumption. But what about the folks who are looking at the pie charts and the promises of over a millions dollars in retirement income? Ah, the powers of compounding. Yes, I have in front of me the literature from 2 national financial service firms that strongly suggest that you too can retire a millionaire for as little as $60/week. Of course there are no guarantees, but the details and assumptions to this rosy scenario on steroids are buried in fine print that youd need an electron microscope to read.
The obvious conclusion most people draw is that interest rates fluctuate and the phenomenon weve witnessed over the past year or so will be transient and eventually higher rates will cycle in and restore the cash flows of fixed income investors. After all, that is what has always happened before, right? Not so fast. There are a couple of reasons to believe this wont happen anytime soon.
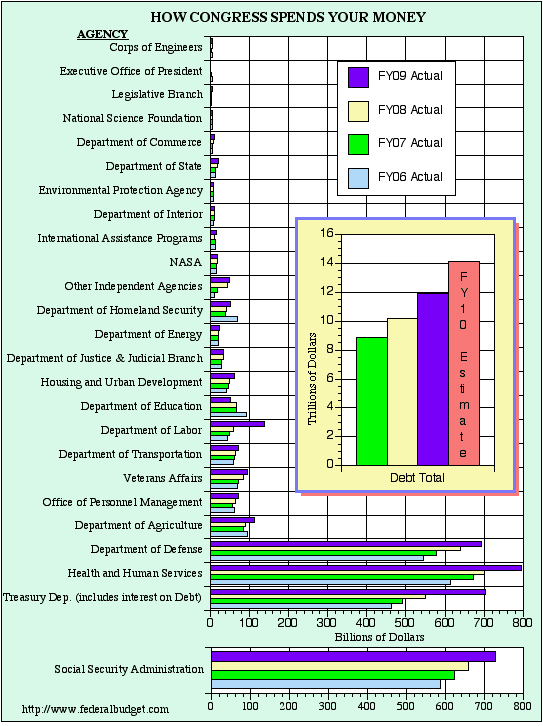
As the graphic below outlines, the Treasury Dept (including debt service) is the third largest line item in the actual FY 2009 budget, at over $700 billion. According to Treasury Direct, the interest paid on the national debt in FY2009 was around $383 Billion. This constitutes an average interest rate of just over 3.1%. Doing a little projecting, if the deficit runs at the estimated $1.5 trillion for FY 2010, the Treasury will need to pay out an additional $431 Billion to service the debt assuming the same 3.1% average interest rate. If early results mean anything though, the amount might be much higher. In the first four months of FY2010, the Treasury has already paid out $164 Billion in debt service, which is setting a pace for nearly $500 Billion. For FY2009, tax revenues were $2.211 Trillion and interest payments on the debt ate up 17% of tax receipts. If the current trend in FY2010 continues, debt service will gobble up around 22% of tax receipts by the time the fiscal year ends next September 30.
While 17% doesnt sound too bad, think about paying nearly 1/5 of your net income every year to credit card companies. Not a real appetizing thought, but certainly this application of sanity couldnt apply to the federal government.

The Problem
The problem here lies in the fact that the national debt is forecast to increase dramatically in the next 10 years. Estimates range anywhere from $18 to $23 Trillion depending on whose forecast youd like to use. Lets use $18 Trillion as our test case. At this level, assuming an average interest rate of 3.1%, debt service by 2019 will cost around $558 Billion per year. If tax revenues dont change, debt service will eat up 25% of tax receipts. The conclusions that can be drawn from this simple analysis are pretty clear. If the government intends to provide the same levels of service on entitlement programs and maintain other government spending, the deficit will need to increase each year just to accommodate the additional debt service. This is called a spiral. It is akin to the family taking cash advances on a VISA to pay off Mastercard. I am sure there are many who will disagree with this rationale and call me all sorts of vile names for suggesting that were spending beyond our means and that somehow this really isnt a good thing. Unfortunately, in reality, this situation is actually worse than the above paragraph indicates for a second, less publicized reason.
Artificial Interest Rates
Lets start at the beginning here. Interest rates are payments given to lenders of capital for the privilege of using their money for a period of time. At a very minimum, the interest rate should ensure that the lenders purchasing power doesnt diminish due to making the loan. In other words, at the very least, interest rates must equal inflation. Such a situation is generally referred to as free money since the lender isnt actually being compensated for the loan in real terms.
When discussing the federal government and its inclination to spend beyond its means, interest rates are a very important topic at the US Treasury, as they should be. This is one of the reasons why government officials, Fed chairmen, and the absentee press generally try to temper inflationary expectations. If lenders expect inflation, then theyre going to want to see higher interest rates.
I have argued for several years now in this column that inflation in the US is grossly understated, and that it is done for both political expediency and out of absolute necessity, especially in an era of ballooning government debt. John Williams at shadowstats.com estimates (using previous BLS methodologies) that price inflation in the US is currently around 6% per annum. If we had free market interest rates, we would expect the yield curve to start somewhere around 7%, assuming Johns numbers are accurate, and there is no reason to believe that is not the case. It is very easy to see the implications this would have for debt service.
Lets assume for a moment that under a free market interest rate environment, the US Government could achieve an average borrowing cost of 6.7%, allowing for a similar spread between price inflation and the mean interest rate as what we observe now. Debt service in FY2009 would have been $831 billion and devoured 38% of tax receipts. In 2019, using the same assumptions as previously mentioned, debt service would be $1.2 Trillion and eat up a whopping 55% of tax receipts. I understand there are many assumptions made here, many of which might fluctuate over the period, but the goal of the exercise is to make the simple point that the US cannot afford market interest rates.
It should now be easy to see why inflation is consistently understated, and why the FOMC and its minions are quick to temper inflationary expectations. While that might work to a limited extent when dealing with the general public, does anyone think for a minute that investors around the world dont know what is going on here? Most of them are doing the exact same thing, albeit to a lesser extent, so you can bet they do.
In Conclusion
Many might look at the above analysis and wonder why it is any big deal. Keep the rates buried at near zero and we can keep getting free money, right? The problem is that mispriced capital leads to misallocation of the same. The gross misallocation of capital is one of the main ingredients of the ongoing financial crisis. It was willfully done by the Fed previously and it is being done again. These actions will virtually guarantee more misallocation of capital, more bubbles, and more unpleasant results. For savers, the news continues to be bad. We have demonstrated why it is in the governments interest (a necessity really) to keep rates as low as possible. That means a continuation of the ridiculously low money market, CD and savings account rates. No doubt the pie charts referenced at the top of the essay will need some changing; it seems someones taken a few slices away.
This Week in the Markets
US equity markets are getting hammered early this Thursday morning on news that first time jobless claims jumped to 496,000 last week. First time claims have been trending upward over the past few weeks. Yesterday, new home sales put in the worst performance in the history of the data series. This despite the extension of the tax credit program for first-time (and now other) homebuyers. Bad weather was blamed for much of the sour performance. It seems recently the weather is getting blamed for any data point that isnt in line with the slow but steady recovery mantra being put out by the establishment. Oil is back at the $80 mark after being beaten down over the past couple of weeks. On the demand side, petroleum product demand appears to be bottom bouncing; any serious increase in demand will be bad news for consumers at the pump this summer. Forecasts are already in for an average pump price of $3.25-$3.50 this summer.
Until Next Time,
Graham Mehl is a pseudonym. He is not an âinsiderâ. He is required to use a pseudonym by the policies of his firm when releasing written work for public consumption. Although not an insider, he is astonishingly bright, having received an MBA with highest honors from the Wharton Business School at the University of Pennsylvania. He has also worked as an analyst for hedge funds and one G7 level central bank.
Andy Sutton is a research and freelance Economist. He received international honors for his work in economics at the graduate level and currently teaches high school business. Among his current research work is identifying the line in the sand where economies crumble due to extraneous debt through the use of economic modelling. His focus is also educating young people about the science of Economics using an evidence-based approach.